
0
Owner's of the Canon Digital Camera Canon EOS 70D DSLR Camera with 18-55mm Lens gave it a score of 0 out of 5. Here's how the scores stacked up:

295
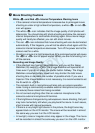
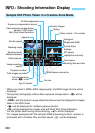
B: Shooting Information Display
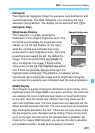
Histogram
The brightness histogram shows the exposure level distribution and
overall brightness. The RGB histogram is for checking the color
saturation and gradation. The display can be switched with [33:
Histogram disp.].
[Brightness] Display
This histogram is a graph showing the
distribution of the image’s brightness level. The
horizontal axis indicates the brightness level
(darker on the left and brighter on the right),
while the vertical axis indicates how many
pixels exist for each brightness level. The more
pixels there are toward the left, the darker the
image. The more pixels there are toward the
right, the brighter the image. If there are too
many pixels on the left, the shadow detail will be
lost. If there are too many pixels on the right, the
highlight detail will be lost. The gradation in-between will be
reproduced. By checking the image and its brightness histogram,
you can see the exposure level inclination and the overall gradation.
[RGB] Display
This histogram is a graph showing the distribution of each primary color’s
brightness level in the image (RGB or red, green, and blue). The horizontal
axis indicates the color’s brightness level (darker on the left and brighter
on the right), while the vertical axis indicates how many pixels exist for
each color brightness level. The more pixels there are toward the left, the
darker and less prominent the color. The more pixels there are toward the
right, the brighter and denser the color. If there are too many pixels on the
left, the respective color information will be lacking. If there are too many
pixels on the right, the color will be too saturated with no gradation. By
checking the image’s RGB histogram, you can see the color’s saturation
and gradation condition, as well as white balance inclination.
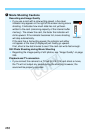
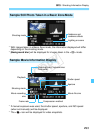
Sample Histograms
Dark image
Normal brightness
Bright image
COPY


Find Your Products By Category
- Lawn and Garden
- Computer Equipment
- TV and Video
- Laundry Appliance
- Kitchen Appliance
- Car Audio and Video
- Automotive
- Photography
- Fitness & Sports
- Personal Care
- Communications
- Home Audio
- Portable Media
- Musical Instruments & Equipment
- Baby
- Household Appliance
- Cell Phone
- Marine Equipment
- Outdoor Cooking
- Power Tools
- Video Game
Please Login
