
0
Owner's of the Casio Calculator FX-300ESPLUS gave it a score of 0 out of 5. Here's how the scores stacked up:

E-23
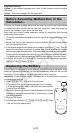
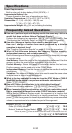
Important: • All data currently input in the Stat Editor is deleted whenever
you exit the STAT Mode, switch between the single-variable and a paired-
variable statistical calculation type, or change the Stat Format setting on the
setup menu. • The following operations are not supported by the Stat Editor:
m, 1m(M–), 1t(STO). Pol, Rec, ÷R, and multi-statements also
cannot be input with the Stat Editor.
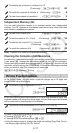
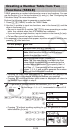
To change the data in a cell: In the Stat Editor, move the cursor to the cell
that contains the data you want to change, input the new data, and then
press =.
To delete a line: In the Stat Editor, move the cursor to the line that you want
to delete and then press Y.
To insert a line: In the Stat Editor, move the cursor to the location where
you want to insert the line and then perform the following key operation:
11(STAT) 3(Edit) 1(Ins).
To delete all Stat Editor contents: In the Stat Editor, perform the following
key operation: 11(STAT) 3(Edit) 2(Del-A).
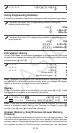
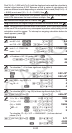
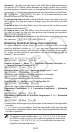
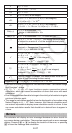
Obtaining Statistical Values from Input Data
To obtain statistical values, press A while in the Stat Editor and then
recall the statistical variable ( σ
x , Σ x
2
, etc.) you want. Supported statistical
variables and the keys you should press to recall them are shown below.
For single-variable statistical calculations, the variables marked with an
asterisk (*) are available.
Sum: Σ x
2
*, Σ x *, Σ y
2
, Σ y , Σ xy , Σ x
3
, Σ x
2
y , Σ x
4
11(STAT) 3(Sum) 1
to
8
Number of Items:
n *, Mean: o*, p, Population Standard Deviation: σ x *,
σ
y , Sample Standard Deviation: s x *, s y
11(STAT) 4(Var) 1
to
7
Minimum Value: minX*, minY, Maximum Value: maxX*, maxY
11(STAT) 5(MinMax) 1
to
2
(When the single-variable statistical calculation is selected)
11(STAT) 6(MinMax) 1
to
4
(When a paired-variable statistical calculation is selected)
First Quartile: Q1, Median: med, Third Quartile: Q3
11(STAT) 5(MinMax) 3 to 5
(When the single-variable statistical calculation is selected.)
Regression Coefficients: A, B, Correlation Coefficient:
r , Estimated
Values:
m, n
11(STAT) 5(Reg) 1
to
5
Regression Coefficients for Quadratic Regression: A, B, C, Estimated
Values:
m
1
, m
2
, n
11(STAT) 5(Reg) 1
to
6
• See the table at the beginning of this section of the manual for the regression
formulas.
•
m, m
1
, m
2
and n are not variables. They are commands of the type that take
an argument immediately before them. See “Calculating Estimated Values”
for more information.
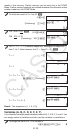
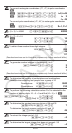
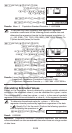
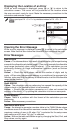
To input the single-variable data x = {1, 2, 2, 3, 3, 3, 4, 4, 5}, using
the FREQ column to specify the number of repeats for each items
({ x
n
; freq
n
} = {1;1, 2;2, 3;3, 4;2, 5;1}), and calculate the mean and
population standard deviation.
2


Find Your Products By Category
- Lawn and Garden
- Computer Equipment
- TV and Video
- Laundry Appliance
- Kitchen Appliance
- Car Audio and Video
- Automotive
- Photography
- Fitness & Sports
- Personal Care
- Communications
- Home Audio
- Portable Media
- Musical Instruments & Equipment
- Baby
- Household Appliance
- Cell Phone
- Marine Equipment
- Outdoor Cooking
- Power Tools
- Video Game
Please Login
