
0
Owner's of the Oregon Scientific Marine Radio Oregon Scientic Pro Weather Station gave it a score of 0 out of 5. Here's how the scores stacked up:
8
EN
NOTE The unit of all temperature related displays will be
changed simultaneously.
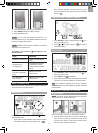
To view temperature (Current / Min / Max temperature)
readings:
1. Press SELECT to navigate to the Temperature Area.
will show next to the Area.
2. Press
/ to select the channel.
3. Press MAX / MIN to toggle between current / MAX /
MIN displays.
To view humidity (Humidity, Dew point) readings:
1. Press
SELECT to navigate to the Humidity Area.
will show next to the Area.
2. Press / to select the channel.
3. Press MODE repeatedly to toggle between the
humidity / dew point displays.
4. Press MAX / MIN to toggle between current / MAX /
MIN displays.
The timestamp is displayed accordingly in the Clock
Area.
To clear the memories and timestamp for the
temperature, humidity and dew point readings:
In the Temperature or Humidity Area, press and hold MAX
/ MIN to clear the readings.
NOTE The dew point advises at what temperature
condensation will form.
TEMPERATURE AND HUMIDITY TREND
The trend lines are shown next to the temperature and
humidity readings. The trend is shown as follows:
RISING STEADY FALLING
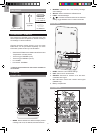
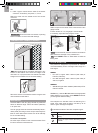
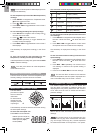
WIND CHILL / DIRECTION / SPEED
The base station
provides wind speed
and wind direction
information.
To read the wind
direction find the
compass point the
is pointing to.
The timestamp records the date and time when storing
the wind speed readings.
To select the wind speed unit:
Press UNIT to switch between:
• Metres per second (m / s)
• Kilometers per hour (kph)
• Miles per hour (mph)
• Knots (knots)
The wind level is shown by a series of icons:
ICON LEVEL DESCRIPTION
N/A <2 mph (<4km/h)
Light 2-8 mph (3~13 km/h)
Moderate 9-25 mph (~14-41 km/h)
Strong 26-54 mph (~42-87 km/h)
Storm >55 mph (>88 km/h)
To view the maximum wind speed and minimum wind
chill readings:
1. Press SELECT to navigate to the Wind Speed / Wind
Direction / Wind Chill Area.
will show next to the
Area.
2. Press MAX / MIN to toggle between current / MAX
wind speed and current / MIN wind chill displays.
The timestamp is displayed accordingly in the Clock
Area.
To clear minimum wind chill reading / maximum wind
speed reading:
1. Press SELECT to navigate to the Wind Speed / Wind
Direction / Wind Chill Area.
will show next to the
Area.
2. Press MAX / MIN
repeatedly until minimum wind
chill reading or maximum wind speed reading is
displayed.
3. Press and hold
MAX / MIN to clear the readings.
NOTE The wind chill factor is based on the combined
effects of temperature and wind speed. Displayed wind
chill is calculated solely from Channel 1 sensors.
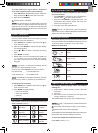
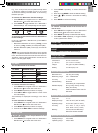
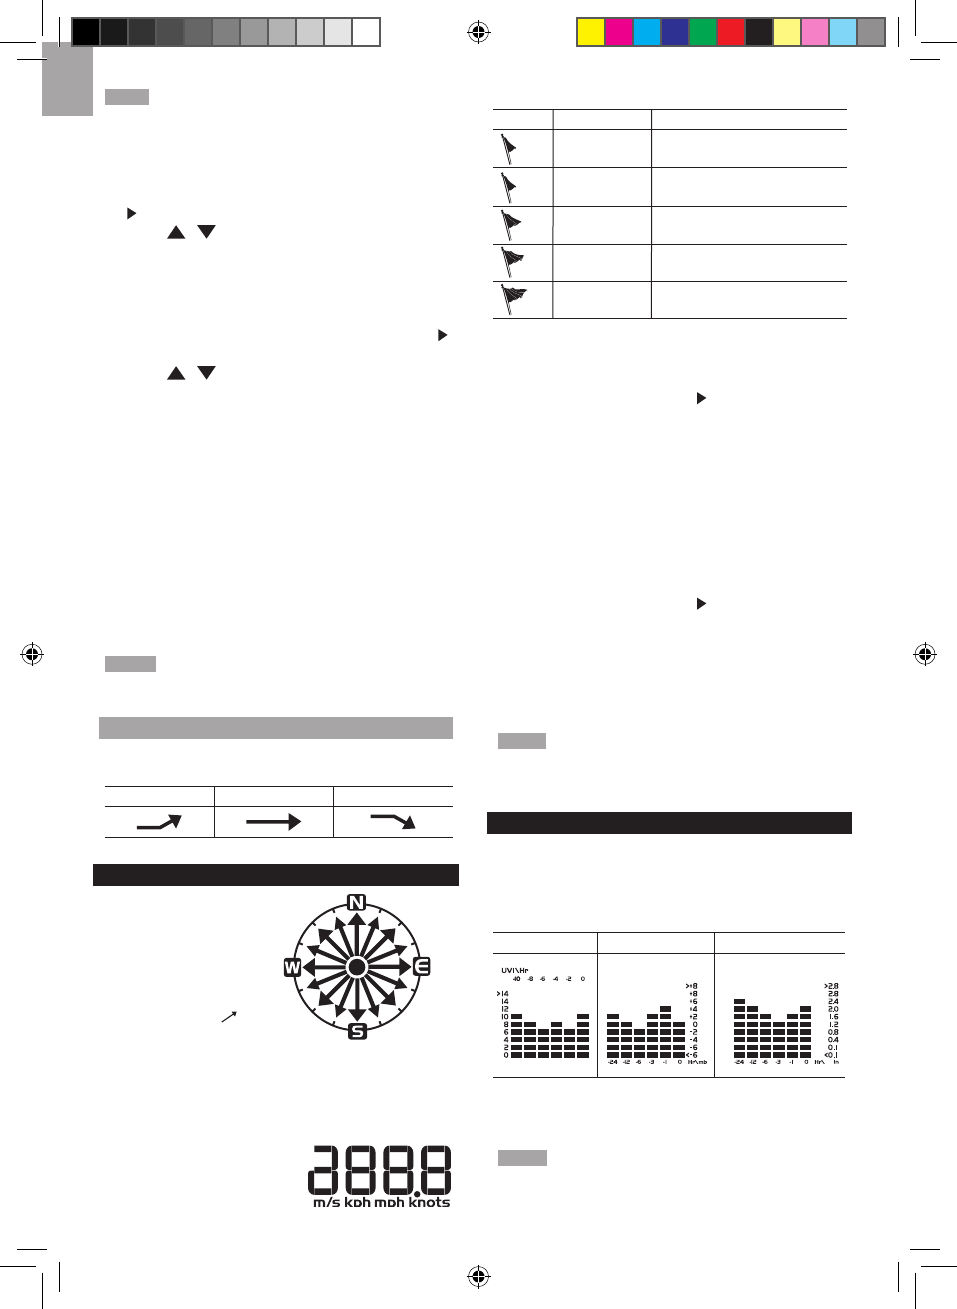
UVI / BAROMETER / RAINFALL
The weather station works with one UV sensor and
one rain gauge. The station is capable of storing and
displaying the hourly history data for the last 10 hours
of UV index, and 24
hours of rainfall and barometric
pressure readings.
UVI BAROMETER RAINFALL
The bar chart display shows the current and historical
data for the UV index, barometric pressure and rainfall
readings.
NOTE The number shown in the horizontal axis (Hr)
indicates how long ago each measurement was taken
(e.g. 3 hours ago, 6 hours ago, etc.). The bar represents
the measurement taken for that specific 1 hour period.


Find Your Products By Category
- Lawn and Garden
- Computer Equipment
- TV and Video
- Laundry Appliance
- Kitchen Appliance
- Car Audio and Video
- Automotive
- Photography
- Fitness & Sports
- Personal Care
- Communications
- Home Audio
- Portable Media
- Musical Instruments & Equipment
- Baby
- Household Appliance
- Cell Phone
- Marine Equipment
- Outdoor Cooking
- Power Tools
- Video Game
Please Login
