
0
Owner's of the Panasonic Blood Pressure Monitor Panasonic Blood Pressure Monitor gave it a score of 0 out of 5. Here's how the scores stacked up:
21
English
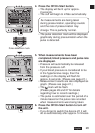
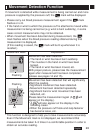
Measuring Your Blood Pressure (cont.)
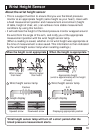
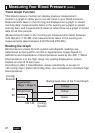
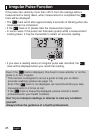
Trend Graph Function
This blood pressure monitor can display previous measurement
results in a graph to allow you to see the trend in your blood pressure.
Measurements taken in the morning are displayed as a graph in stored
morning data; measurements taken in the evening as a graph in stored
evening data; and measurements taken at other times as a graph in stored
data for all time periods.
(Measurements taken in the morning are measurements taken between
3:00 AM and 11:00 AM, and measurements taken in the evening are
measurements taken between 6:00 PM and 2:59 AM.)
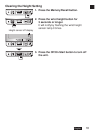
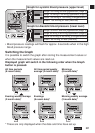
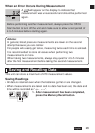
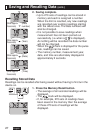
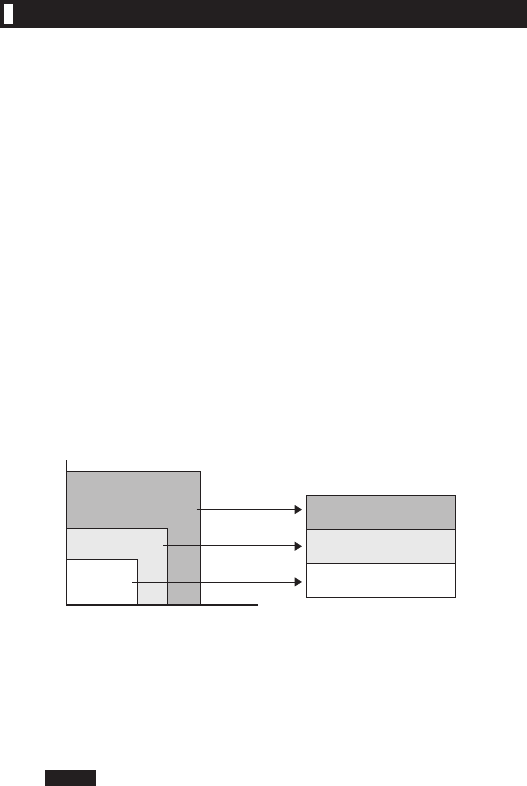
Reading the Graph
Blood pressure values for both systolic and diastolic readings are
determined as being within normal or hypertensive ranges based on
definitions and classification of blood pressure levels by the JNC 7. When
blood pressure is in the high range, the reading displayed on screen
flashes on and off to alert user.
According to JNC 7 Classification, values consistently in excess of
140 mmHg (Sys.) and/or 90 mmHg (Dia.) are considered to constitute high
blood pressure.
(mmH
g
)
Systolic
120 140
80
90
(mmH
g
)
Diastolic
Hypertension
(Stage 1, Stage 2)
Prehypertension
Normal
Orange
Background color of the Trend Graph
Yellow
Green


Find Your Products By Category
- Lawn and Garden
- Computer Equipment
- TV and Video
- Laundry Appliance
- Kitchen Appliance
- Car Audio and Video
- Automotive
- Photography
- Fitness & Sports
- Personal Care
- Communications
- Home Audio
- Portable Media
- Musical Instruments & Equipment
- Baby
- Household Appliance
- Cell Phone
- Marine Equipment
- Outdoor Cooking
- Power Tools
- Video Game
Please Login
